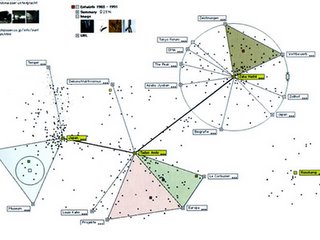
Through fluctuat.net, I found the following web site that displays many different solutions to displaying the complexity of networks. I am trying to use Google map to map the current bird flu and how it propagates and I am not sure how certain data should be displayed. This should help.
No comments:
Post a Comment