Showing posts with label maps. Show all posts

Saturday, September 13, 2008

Leaving Houston

I have talked about Leaving Houston before when under pressure from the elements. Here are data that did not know existed in 2005. Doppler radar data over houston (Looks like it is avoiding Texas A&M University)


and a view of what a 4 meter or 6 meter flood can do to the Coast and live view of the weather.


Thank you Pedro for the one-week heads-up.

Friday, November 23, 2007

StrangeMaps, Nuclear Power, HASP, ML in Space, GPU with Matlab

Taking a break from Compressed Sensing for a moment, here is a strangely addictive site reviewing different types of maps. It's called Strangemaps. Quite timely my first blog entry was about maps and it was about four years ago. Google Maps did not exist then. Things changed indeed, now environmentalists are cheering for nuclear power this is quite a turn of event for those of us who have been in the nuclear engineering field.
Talking about Mississippi, LSU is accepting application for the next HASP flight and the deadline is December 18th. The big difference between a HASP flight and that of a sounding balloon can be found here:

A sounding balloon project I am following with much interest is project WARPED. They have an excellent technical description of what they are doing.


In other news from the KDnuggets weekly e-mail, some items caught my attention: Maybe the birth of a new kind of Journalism in What Will Journalist-Programmers Do?and there is a CFP on the subject of Machine Learning in Space, (Mar 31)

Via GPGPU, AMD is talking about introducing double precision in frameworks using GPUs (Graphics Cards). On the other hand, the NVIDIA CUDA compiler now has a Matlab plug-in where whenever you use a function in Matlab like FFT, this plug-in takes over the job and send it to the Graphics card (GPU). Maybe we can do faster reconstruction in Compressed Sensing using a Partial Fourier Transform and a GPU. Oops I did it again, I spoke about CS.

Tuesday, September 18, 2007

Imaging from the sky: When You Become The Map

There is a new call from the HASP folks about submitting new payloads to be flown next year in a NASA high altitude balloon. Deadline is December 18, 2007, it is directed toward undergraduate projects.
From the HASP website:

September 17, 2007: HASP CALL FOR PAYLOADS 2007-2008 RELEASED: The HASP Call for Payloads 2007-2008 (CFP) has been released and application materials are now available on the HASP website “Participant Info” page. Student groups interested in applying for a seat on the September 2008 flight of HASP should download these materials and prepare an application. New for this year is an increase in the allowed weight of the student payloads. Small class payloads can now mass up to 3 kilograms and large class payloads can weigh as heavy as 20 kilograms. Applications are due December 18, 2007 and selections will be announced by mid-January 2008.


The photos below and sideways are a 10 percent composite of several photos taken at 30,000 feet, with a 3x optical zoom at 500 mph. The speed makes it very unl
ikely to get any good details without some type of processing. And so, for the time being, imaging the ground with some type of precision with some type of point and shoot camera seems to be only feasible to payloads on balloons.
Compared to satellite imagery, one of the interesting capability is to remove the effect of clouds when possible. In satellite imagery, cameras work with pushbroom technology where the imager is a line of pixels (not a square dye). One consequence is the inability of photographing twice the same object with one sweep. Using off the shelf cameras on much slower balloons allow one to obtain multiple images of the same object at different angle. This is important when one wants to evaluate whether the object is noise or not.

Chris Anderson of the Long Tail book mentioned a different approach by Pict'Earth to using images from the sky using UAVs and patching them into Google Earth. This is interesting, but as I have mentioned before, when you take enough images, you don't need Google Earth, you don't need the headache of re-projecting these images onto some maps (even though it looks easier with Yahoo Map Mixer for small images), because you are the map. No need for IMUs or GPS instrumentation. This is clearly an instance of advances in stitching algorithms removing hardware requirements on the sensors. As for the current results Chris is getting from PTGui, I am pretty sure the autopano folks will enable the orthographic projection soon in order to cater to that market. With balloons, the view is from very far, so the patching algorithm has no problem stitching images together. In the case of UAVs, you need the orthographic projections.

Eventually, two other issues become tremendously important (especially in the context of Search And Rescue). Cameras and memory are going cheaper and one is faced with GB's of data to store, map and share. Our experience is that the sharing is challenging when you go over 2 GB of data mostly because of small file format limits (2 GB). Zoomify is interesting and they need to figure out a way to deal with larger images. While Autopano allows for images taken at different times to be overlayed with each other (a very nice feature), the viewer might be interested in this time information. Right now I know of no tool that allows one to switch back and forth between different times for the same map.

References:

1. Comparing Satellite Imagery and GeoCam Data
2. A 150-km panoramic image of New Mexico

Wednesday, March 14, 2007

Implementing Compressed Sensing in Applied Projects


We are contemplating using Compressed Sensing in three different projects:


  • The Hyper-GeoCam project: This is a payload that will be flown on the HASP platform in September. Last year, we flew a simple camera that eventually produced a 105 km panorama of New Mexico. We reapplied for the same program and have been given the OK for two payloads. The same GeoCam will be re-flown so that we can produce a breath taking panorama from 36 km altitude. The second payload is essentially supposed to be a hyperspectral imager on the cheap: i.e. a camera and some diffraction gratings allowing a fine decomposition of the reflected sun light from the ground. The project is called Hyper-GeoCam and I expect to implement a random lens imager such as the one produced at MIT. Tests will be performed on the SOLAR platform.
  • The DARPA Urban Challenge: We have a car selected in the track B: We do not have Lidars and need to find ways to navigate in an urban settings with little GPS availability. The autonomous car is supposed to be navigating in a mock town and follow the rules of the California traffic laws, that includes passing other cars.
  • Solving the Linear Boltzmann equation using compressed sensing techniques:The idea is that this equation has a known suite of eigenfunctions (called Case eigenfunctions) and because they are very difficult to use and expand from, it might be worth a try to look into the compressed sensing approach to see if it solves the problem more efficiently.

Thursday, February 15, 2007

Finding Jim Gray: Approximate Data Fusion/ An inference problem


We are dealing with an inference problem of the worst kind. Trying to find a target of unknown spectral signature in a different areas over time knowing that it moved over time. The drift models are essential in figuring out how the same target can be transported from location to another. We are also facing the fact that there are many elements, also of unknown signature that do not follow the drift models (because they are doing everything possible to go from point A to point B) or are spectrally equivalent to our target of interest. In other words we have to find a target of interest for which, given a drift model, is consistently identified when weather permits as being in the near vicinity of a target as detected by the different sensors and means of acquisition. In particular, the question of why the coast Guards did not see anything on Feb 1 must be answered.


Day 2.6

Day 4.8
Day 5.1

Maria Nieto-Santisteban and Jeff Valenti at John Hopkins University (The JHU group) have used the ocean current models provided by the OurOcean folks at JPL to create an animated GIF of how markers move with the currents. Relevant satellite and aerial imagery were obtained 2.6, 4.8, 5.1, and 5.8 days after the adopted zero point in time (Jan 29, 00:00 GMT).

The Radarsat images do not suffer from the clouds or fog. They were also taken very early on the search (Jan 31 and Feb 3). Quickbird and Ikonos shots would be useful in evaluating if any of the radar targets are of interest. My assumption is that Tenacious responded to the radar but was probably covered by clouds when visible light satellite or planes (ER-2) passed over it.
Following this thinking, I produced a kml file for the Radarsat images as processed by Maria and Jeff (it needs to be polished, anybody ?) and probably needs to have the ER-2 data. The Mechanical Turk data findings are not available online. One can see part of the kml file directly on Google Maps but it does not display well because it is too big for Google Maps in this fashion.

The major capability provided by the JPL folks is in the ability to remove targets that are really false positives. And so instead of looking at ocean current models and try to fit the targets found by Radarsat, it would be interesting to figure out how targets on Jan 31 found by Radarsat were transported to another position on Feb 3 using the model. By evaluating the distance between targets of Jan 31 transported by the JPL model and actual targets found on Feb 3, we would have a good view of the ones for which the model is accurate. Then, we could evaluate if any of the targets found by Quickbird on Feb 2 and Feb 3 are anywhere close (why use the radarsat images first) It is also of paramount importance that one uses the JPL current models with a grain of salt. This is fluid mechanics after all.

By eyeballing the Radarsat targets and the crosses of the JPL model, one seem to see some similar features pointing to the potential correctness of the ocean current model. Some of targets could be removed using the Quickbird imagery.


Monday, February 12, 2007

Finding Jim Gray: Quantifying the state of our knowledge / Quantifying the state of our ignorance


The more I am looking at some of the multispectral images, the more I am convinced that the obstruction of the clouds should not be discounted. But more importantly, another issue is the data fusion from different sensors.
Thanks to both the John Hopkins and the University of Texas websites, we have data from a radar (radarsat) or in the visible wavelength regime (ER-2, Ikonos, Coast guard sightings). Every sensor has a different spatial and spectral resolution yet some can see through clouds whereas others cannot. Multispectral could be added to this mix but they suffer from low spatial resolution (lower than the radar) while having higher spectral resolution. Other information such as human sightings by private airplane parties should also be merged with the previous information. [ As a side note I have a hard time in convincing the remote sensing people that spatial resolution is not an issue as long as we can detect something different from the rest of the background.]

Finally, the other variable is time. Some areas have been covered with different sensors at different times. This is where the importance of the drift model become apparent.


The state of our knowledge of what is known and what is not known becomes important because as time passes by, it becomes difficult to bring about the resources of search and rescue teams. I have been thinking about trying to model this using a Maximum Entropy (Maxent) but any other modeling would be welcomed I believe. The point is that when a measurement is taken at one spatial point, we should look at it as if it were a measurement that will vary with time. The longer you wait, the more you won't know if the Tenacious is there or not.
For those points were we have identified potential targets, we need to give them some probability that Tenacious is there but we also know that if we wait long enough, there will be a non-null probability to have gone away from that point. Also, this formalism needs to allow us to portrait the fact that no measurements were taken over certain points in a region where other points were taken (the issue of clouds). This is why I was thinking of implementing a small model based on the concept of Probabilistic Hypersurface a tool designed to store and exploit the limited information obtained from a small number of experiments (a simplified construction of it can be found here). In our case, the phase space is pretty large, each pixel is a dimension (a pixel is the smallest pixel allowed for the spatial resolution of the best instrument). All pixels together represent the spatial map investigated (this is a large set). The last dimension is time. In this approach the results of JHU and UCSB as well as the Mechanical Turk could be merged pretty simply. This would enable us to figure out if any of the hits on Ikonos can be correlated to the hits on Radarsat. But more importantly, all the negative visual sightings by the average boater could be integrated as well in there because a negative sighting is as important as a positive one in this search. And if computational burden become an issue for the modeling, I am told that San Diego State is willing to help out big time.
[added note:
What I am proposing could already be implemented somewhere by somebody who is working in areas of bayesian statistics, maximum entropy techniques. Anybody ?]

Friday, July 15, 2005

GIS on steroids


In my first entry in this blog, I made the plea for better and cheaper maps. That was a year and a half ago. Now Google, has come up with two different services that enable pretty much everybody to superimpose additional layer of data on maps and satellite imagery.
The services are Google Maps and Google Earth. The first service has an API that allows people to use it and add features to the initial service provided by Google. Google Maps Mania lists all these new ideas and the amount of them keep on growing everyday. The space shuttle Discovery lifted off yesterday and one can already see bow different aspect of these services can be used, first one can see where the launchpad was. The same capability can be used to figure out the location of the International Space Station and the Shuttle. Other examples putting meaning and geography together can be found here and there. Fascinating. One can always think of other type of data to be added or how it can be used to tell a story such as that of the Grand Challenge 2004 as John Wiseman did.

Tuesday, December 28, 2004

Treacherous Solitons

If you think that it is just enough to think you have a warning system then you should probably think twice. In fact, it looks like, we really have no warning system in the Atlantic Ocean where a recent research paper show that a larger Tsunami to the one that hit South Asia could occur
and devastate the U.S. eastern sea shore, part of Europe, South America and Africa.
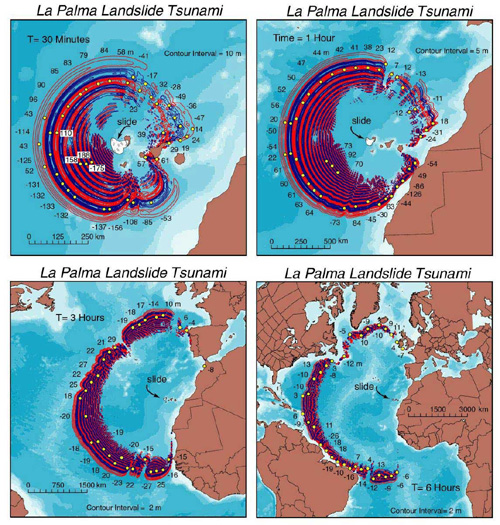
But be reassured some people tell us that no such mega tsunami can exist, well.... until something like MN4 hit us.
As expected, the internet that was supposed to survive in a nuclear war as a means of communication is doing so as seen in this E-mail sent from one of the worst hit part of Indonesia. It also seems to be a good idea to have a GSM phone when traveling.

Friday, December 10, 2004

We still need better maps

Here is a way to deal with navigation in towns: Use cell phones as tour guides. With the ubiquity of cell phones, one can definitely think of a cell phone as replacing previous more expensive solutions.

Thursday, May 20, 2004

Who's close to me

At long last I was looking for a service like this. If you live in one of the fifty largest cities of France, you can give them your address, the type of business you are interested in and it will provide a map with a choice of ten possibilities and ways on how to get there. Some people are trying this in the U.S. as well.

Tuesday, March 16, 2004

We need better maps, actually less expensive ones

This ViaMichelin Espace PDA still requires one to have a PDA (400 $) and then you have to pay up to 200$ for a mapviewer. Still way too expensive.

Friday, March 05, 2004

We need better maps V

Maybe this is the beginning of an answer for a low cost approach to better maps: a disposable Computer . Maybe I should be looking into this ?

Wednesday, February 25, 2004

We need better maps IV

So I am in the plane reading the newspaper and bam, what I was describing earlier is now sold as a product. It is called TomTom. It is a software for mobile devices but it has several problems. First it looks like it is for cars, so it won't work for walking tourists in Paris (specifically having to carry a battery for the gps receiver). Second, it is only for one region of the world. Third, it costs 499 euros and as far as I understand it doesn't include a PocketPC/Palm computer with it. So the final bill for it is pretty steep and I don't see how the price could go down. It is a far cry from a 10 $ solution....

Monday, February 16, 2004

We need better maps III

In this article, they show how a system used in natural parks can provide direction information to mobile tourists. It is interesting for different reasons:
- First, I did not realize Zope could be installed on a palm sized device.
- Second, it is not wireless, a GPS system does the trick. No need for a complex infrastructure. If one were to develop a solution for Paris, there is certainly a market for telling people the story of a particular place. Nearly every street in this town seems to have a link to a particular part of the History. The bar next door for instance is where most french people think WWI was not stopped. An interesting conclusion from this article is that only one third of people are interested in paying for this service. One particular instance of using this type of service in paris is to match the tourist nationality with events/places of interest to their own history. For instance, if you go to the Palais Royal, you can find the place where Bonaparte signed off on the Louisiana Treaty, the place where immigrants from eastern europe decided to join France in WWI to fight the germans, the place where Bolivar lived before going back to South America.....Each of these events has only a particular interest to only certain people of specific nationalities and no paper map could do the trick...

Friday, January 09, 2004

We need better maps II

Following up on one of my concerns. People in Morzine, a french ski resort, came up with this concept: ski nav. It looks like an HP palm of some kind, retroffited with a different logo and a GPS. At 60 euros a week, it still is too expensive for a map in Paris. Well at least, being the power drawer they are, they can always warm you up when you are lost and cold.

Still looking for that sub-10 euro/dollar solution though....I think in an urban environment, one really needs to know pointing directions, answering the question: am I heading the right direction ?

Most tourists I have seen had taken the wrong turn only once. It was enough. And they get lost in broad daylight, no starnav for you...

Friday, November 28, 2003

We need better maps

Here is a new idea: provide a means for some people to move around a town without a map. When I am in Paris, I invariably get to give directions to people with maps in their hands. What is further dumbfounding is that they ask for information while next to one of these big district (arrondissement) maps. Obviously a map or two is not enough. There has to be a solution that does not cost more than $10 that could accomodate this need. A PDA is obviously too expensive, a service on one's cell phone could do the trick (since it already knows one's position) ?

Printfriendly