
Showing posts with label jim gray. Show all posts
Showing posts with label jim gray. Show all posts
Monday, June 27, 2011
Jim Gray's Search
Joe Hellerstein has a blog entry on his recent CACM paper on Jim Gray's search. Other entries related to this search can be found here.

Wednesday, June 25, 2008
Jim Gray's tribute and the Amateur Search.
As some of you may recall, I tried to be of help in the search for Jim Gray last year. His friends and family hosted a tribute to him at Berkeley this past month. The video of the main event can be seen here. It looks like he was a very nice guy.
Mike Olson, presented the amateur search in that video. However to get a better understanding of what was found you really want to see the following presentation.

All the entries that were specific to Jim Gray's search can be found here. All the entries that are more related to search and rescue in general can be found here. As part of the outer circle, this is more information than I had at the time.
Mike Olson, presented the amateur search in that video. However to get a better understanding of what was found you really want to see the following presentation.

All the entries that were specific to Jim Gray's search can be found here. All the entries that are more related to search and rescue in general can be found here. As part of the outer circle, this is more information than I had at the time.
Tuesday, January 01, 2008
Compressed Sensing: Near-ideal model selection by L1 minimization, Machine Learning: Sparse coding, Search and Rescue: InternetSAR

Emmanuel Candes and Yaniv Plan just released this preprint on Near-ideal model selection by L1 minimization. The abstract reads:
We consider the fundamental problem of estimating the mean of a vector y = X \beta + z where X is an n x p design matrix in which one can have far more variables than observations and z is a stochastic error term|the so-called `p higher than n' setup. When \beta is sparse, or more generally, when there is a sparse subset of covariates providing a close approximation to the unknown mean vector, we ask whether or not it is possible to accurately estimate X \beta using a computationally tractable algorithm. We show that in a surprisingly wide range of situations, the lasso happens to nearly select the best subset of variables. Quantitatively speaking, we prove that solving a simple quadratic program achieves a squared error within a logarithmic factor of the ideal mean squared error one would achieve with an oracle supplying perfect information about which variables should be included in the model and which variables should not. Interestingly, our results describe the average performance of the lasso; that is, the performance one can expect in an overwhelming majority of cases where X\beta is a sparse or nearly sparse superposition of variables, but not in all cases. Our results are nonasymptotic and widely applicable since they simply require that pairs of predictor variables be not overly collinear.
The main contribution of the paper is to show that the Lasso works under some conditions and bound on the sparsity level of the signal 'that is, for generic signals, the sparsity can grow almost linearly with the sample size. '
On a unrelated note Lieven Vandenberghe and Joachim Dahl just released version 0.9.2 of CVXOPT: A Python Package for Convex Optimization. An interesting aspect of it is the linking possibilities to OpenOffice spreadsheets.
In the sparse coding world, these three papers got my attention: Shift-invariant sparse coding for audio classification by Roger Grosse, Rajat Raina, Helen Kwong, and Andrew Y. Ng, Self-taught learning: Transfer learning from unlabeled data by Rajat Raina, Alexis Battle, Honglak Lee, Benjamin Packer and Andrew Y. Ng. and Efficient sparse coding algorithms by Honglak Lee, Alexis Battle, Rajat Raina, and Andrew Y. Ng. I'll have to implement some of these in my Monday Morning Algorithm series at some point.
This past year saw some new search and rescue operations that used the knowledge of people through the internet. Somebody involved in the latest search for Steve Fowsett has decided to centralize this type of activity on one site: InternetSAR. An interview with the creator of the site can is here, thanks to a podcast by the folks at AVweb. I blogged several entries on Jim Gray's search and I think that it actually goes beyond having human watching and interpreting satellite photos as I have pointed out before, but this is a good and noteworthy effort in the right direction.
Credit photo: Armagh Observatory, Map of asteroids in the inner part of the Solar System.
Friday, July 13, 2007
Adding Search and Rescue Capabilities (part II): Modeling what we see and do not see
 One of the concern that one has during a search and rescue operation (part I is here) is whether or not, the item of interest was seen or detected. I am not entirely sure for instance that SAROPS includes this, so here is the result of some of the discussions I have had with some friends on this. While the discussions were about the Tenacious, one should keep an eye on how it applies to other types of mishap that may lead to a similar undertaking.
In the search for the Tenacious, there were several sensors used at different times:
- Mark One Eyeball from Coast Guards or from some private parties or from onlookers from the coast
- sensors used by the Coast Guard in Planes and Boats
- sensors (Radar, visual, IR, multispectral) from satellites or high altitude planes
- webcams looking at the SF port and bay.


Each and every one of these sensors give some information about their field of view but they are limited by their capabilities. The information from the sensor is dependent on its resolution and other elements. While the issue of resolution is well understood, at least spatially, sensor visibility is dependent on:
- cloud cover (high altitude, satellites), haze (low altitude)
- the calmness of the sea
- the orientation of the sensor (was the object of interest in the sensor cone ?)
- the ability of the sensor to discriminate the target of interest from the background (signature of the target)
- the size of the target (are we looking for a full boat or debris ?)

In the aerospace business, some of us use software like STK that provides different modules in order to schedule and understand information about specific satellite trajectories and so forth. It may be a good add-on to the current SAROPS capabilities in terms of quantifying the field of view.

But the main issue is really about building the right probability distribution as the search goes on and how one can add any heterogenous information into a coherent view of the search.
Time is also a variable that becomes more and more important as the search goes. In particular it is important to figure out the ability to do data fusion with time stamped data. One can see in this presentation, that while the search grid is regular, one can see some elements drifting out of the field of view as the search is underway. So the issue is really about quantifying data fusion with sensors input as well as maritime currents and provide a probability of escaping the search grid. SAROPS already does some of this, but I am not sure the timing element of the actual search (made by CG planes, boat) is entered in the software as the search go on. It was difficult for us to get back that timing from the search effort (it was rightfully not their priority) and one simply wonders if this is an input to SAROPS when iterating on the first empty searches. If one thinks along the lines of the 8000 containers scenario, this is important as it has been shown that some of these containers have different lifespan at sea level and right under the surface. In this case, the correlation between time stamped sensor outputs become central as a submerged but within a few feet underwater containers may not be viewable from specific sensors (but would remain dangerous to navigation). Also this is not because we did not see anything on the second path at the same location (provided no current) that the object is not here anymore, rather the sensor did not detect it. In the illustration below one can see the different targets found by the Radarsat/John Hopkins team for the Tenacious. Without time stamp it is nearly impossible to make a correlation between hits on the first and the second satellite path.

The bayesian framework seems to have already been adopted by SAROPS and previous versions. It may need some additional capabilities to take into account most the issues mentioned above (sensor network or EPH). In either case, a challenge of some kind, with real data might be a way to advance the current state of the art.
Monday, July 09, 2007
Adding Search and Rescue Capabilities (part I): Using Hyperspectral and Multispectral Cameras to Search for Non-Evading Targets
 In the search for the Tenacious, I mentioned the possibility of using Hyperspectral or multispectral cameras on-board current satellites to see if there was a way to locate it. The big challenge resides in the resolution. Most of these cameras have a coarser resolution than, say, either the Tenacious or any medium sailing boat (i.e. one pixel is more than the size of the boat). Hence the generic expectation is that one cannot locate a boat using these. These cameras are also mostly used for other purposes such as environmental studies and the access is rightfully restricted to a small circle of experts. Because of that there is a large amount of convincing to do in order to have access to that imagery. The underlying reasoning as to why we could, in effect, discriminate between something that is interesting and something that is not, can be put in two categories:
- the boat and its wake span a large part of the pixel and using a few bands, one can see a large difference between a man made object and the sea. In other words, the underlying scene is very sparse and one in effect detect very rapidly interesting artifacts. This a little bit like superresolution.
- In some cameras like Hyperion on EO-1 or Meris (Envisat) there are 250 spectral channels. Even if the spatial resolution is coarse, we are bound to see something different when using 250 bands (as opposed to the traditional three color bands) especially against a very uniform background (sea). Techniques such as the ones developed by Mauro Maggioni and Ronald Coifman should be evaluated for that purpose.
Recall that the idea is to produce a map of what is potentially interesting, not an exact match of where that target is. A second step dealing with data fusion is responsible for eliminating the false positives given information from other sensors. With the help of Lawrence Ong, Sorin Popescu and I showed that you could see boats with Landsat 7. This is new but falls into the first category highlighted above. The second category has not been investigated as far as I know: Maybe it should. There are three categories of targets/signatures that should be investigated:
- During the Tenacious search, a false positive was detected in the form of a sighting of a green dye. These dye are generally part of "distress kits" and used whenever a boat want to make it clear it has problem. While it was a false positive for other reasons, I had a discussion with the EO-1 folks (at JPL and Goddard) who mentioned that maybe producing ground truth data with green dye and Hyperion could probably lead to having a similar capability than the one we currently have for detecting volcanoes. In other words, produce a calibration formula to be fed to EO-1 so that in the future, its autonomous detection capability can provide data to the ground that this green dye has been detected over a specific area. Since one can schedule imagery on EO-1 and figure out Envisat data gathering cycle, this could be done as a small private endeavor.
- Another signature of interest is that of the boat as produced on the camera. If it is a boat or a plane, it is very likely that these have been imaged before by the same camera over the same harbour or airport at some other time. But for the latter, a signature is not really that important per se. A large signal over background noise on some channels should be enough to find that boat/plane. In the case of the plane, the signature may be interesting as the background is generally cluttered.
- In order to verify the ability to find current boats at sea, one could try to locate the boats currently involved in much advertized journeys or races. One could find out from the current stock of envisat and eo-1 photos whether boats like the Schooner Anne can be located. That boat is part of a 1000 days at sea journey. They have a map of their location day after day. The boat is a schooner (or about 120 feet large).
Another item that would have sped up the search is the ability to query simultaneously different databases on the availability of hyperspectral or multispectral images from different platforms. Either USGS or the ESA platforms are very nice, but making it into one search would have been a nice time saver. I am also pretty sure that there are other Earth Observation platforms from Asia (India in particular) that could have been used, provided I knew about them. Yet I cannot find anywhere on the web a catalog of civilian hyperspectral or multispectral imagers on current satellites.
Finally, let us recall that doing this can help us locate hard cases like the Tenacious but it may also help us in a totally different endeavor. As one can see from the extraordinary effort of the Coast Guards for the Tenacious, one boat can consume a large amount of man power. Let us imagine a case where you have to do the tracking of 8000 targets lost at sea.

In the search for Cessna N2700Q, the Civil Air Patrol tried the new ARCHER system without su
 ccess on that search. And it looks like this is not happening only for this search as some people are doubting its capability for Search and Rescue Operations.
As indicated by Bradley,
CAP forum posts indicate ARCHERThis is the same problem that arises for EO-1, the swath of interest is generally very narrow compared to the size of the problem. We should probably think of a way of integrating Compressed Sensing into current hyperspectral imagery to increase the field of view. Let us recall that one of the reason this would be interesting is that these systems are there to point out major differences from the background, they are not there to produce very nice imagery.
requires a very narrow search area to be of much use. Our problem is that we're not sure where this Cessna pilot went after he dropped
below radar (N34° 48' 7" , W111° 56' 52").
If any of those items are of interest to you please contact me. I am particularly interested in people (from Asia, Europe or the U.S.) that can have direct access to this type of imagery so we can test some of what is said in this entry.
[ Si vous pensez que ce sujet est important et qu'il doit etre etudie, je serais tres heureux de pouvoir vous aider. N'hesitez pas a me contacter ]
Wednesday, July 04, 2007
Is it time for a lessons learned from Jim Gray's search and rescue operation ?
I have been in touch with another search team ever since the disappearance of Jim Gray's boat and it seems to me that there are similar items that probably need to be thought better in terms of communication, data handling and fusion.
Saturday, April 21, 2007
Bayesian Search and Rescue
While some people are still looking for Jim Gray there are a number of issues that eventually need to be investigated at the Science and Technology level. While the current SAROPS capabilities of the Coast Guards are very impressive, there may be ways to improve some of its already powerful capabilities. I recently came across a technique that could probably have helped in solving the Tenacious Challenge. It is entitled: Coordinated Decentralized Search for a Lost Target in a Bayesian World [1] by Frederic Bourgault, Tomonari Furukawa and Hugh F. Durrant-Whyte. The abstract reads as follows:
and looks like the type of approach I was mentioning earlier. This one article takes as a starting point the tragedy of the 1979 Fastnet race. As it turns out, another Tenacious won that race. I will be sharing my thoughts on this technique and other possible improvements in a future entry. A related subject of interest is sensor networks since we had a mix of different sensors watching the same areas at different times.
[1] Intelligent Robots and Systems, 2003. (IROS 2003). Proceedings. 2003 IEEE/RSJ International Conference on. Publication Date: 27-31 Oct. 2003, Volume: 1, On page(s): 48- 53 vol.1.
This paper describes a decentralized Bayesian approach to coordinating multiple autonomous sensor platforms searching for a single non-evading target. In this architecture, each decision maker builds an equivalent representation of the target state PDF through a Bayesian DDF network enabling him or her to coordinate their actions without exchanging any information about their plans. The advantage of the approach is that a high degree of scalability and real time adaptability can be achieved. The effectiveness of the approach is demonstrated in different scenarios by implementing the framework for a team of airborne search vehicles looking for a stationary, and a drifting target lost at sea.
and looks like the type of approach I was mentioning earlier. This one article takes as a starting point the tragedy of the 1979 Fastnet race. As it turns out, another Tenacious won that race. I will be sharing my thoughts on this technique and other possible improvements in a future entry. A related subject of interest is sensor networks since we had a mix of different sensors watching the same areas at different times.
[1] Intelligent Robots and Systems, 2003. (IROS 2003). Proceedings. 2003 IEEE/RSJ International Conference on. Publication Date: 27-31 Oct. 2003, Volume: 1, On page(s): 48- 53 vol.1.
Thursday, March 01, 2007
Current use of EO data for Search And Rescue operations (SAR)
The current use of Earth Observation data is directed toward using wind scattometer data and include them directly into the drift modeling used for Search and Rescue Operations of known objects (objects for which we know the original location but want to know more about drift).

What is interesting is the apparent mismatch between the model data and the EO actual observations as shown by Michel Olagnon from IFREMER in the photo below (the picture shows the model color with satellite swath lines providing real information, the mismatch show the inaccuracy of the model).

With regards to data fusion in the current SAROPS software by the USCG, it looks like the current configuration only include overlays of low resolution.

it does not seem to address the ability to image directly the objects of interest (either a boat lost at sea or drifting containers) .

What is interesting is the apparent mismatch between the model data and the EO actual observations as shown by Michel Olagnon from IFREMER in the photo below (the picture shows the model color with satellite swath lines providing real information, the mismatch show the inaccuracy of the model).

With regards to data fusion in the current SAROPS software by the USCG, it looks like the current configuration only include overlays of low resolution.

it does not seem to address the ability to image directly the objects of interest (either a boat lost at sea or drifting containers) .
Drifting behavior while searching
This series of images comes from the presentation of Art Allen (USCG) on SAROPS. One can clearly sees that drift is an important component of the search activity while the search is underway. Another question begs to be answered: how come the search grid is not uniform in order to provide efficient information ?


Tuesday, February 27, 2007
Data Fusion for Search And Rescue (SAR) Operations

When the Palomares accident took place, I never imagined they used bayesian search theory to find the last empty quiver. According to Wikipedia it so happens that this technique is used by the Coast Guards in search and rescue operations. A similar technique could be used to merge all the information acquired to find Jim Gray.
The search and rescue program seems to now use SAROPS ( a commercial version is SARMAP) where I would expect similar bayesian techniques to be used. I found the other presentation at this SAR conference at Ifremer also very much interesting. The 2006 presentations also present the current SAROPS implementation (link to movie/presentation).

I want to be proven wrong, but I am pretty sure that current tools do not integrate satellite/radar imagery directly into the maps produced to determine search scenarios. It certainly does not integrate other types of imagery (multispectral or other). I would very much be interested in finding out how time is taken into account in these probabilistic maps.

Unlike other approaches, the Bayesian approach maintains multiple hypotheses over time. The probabilistic maps developed for robotics are sensibly similar to the ones needed in the search and rescue case.
[Thanks Cable for the tip]
Friday, February 16, 2007
Finding Jim Gray: the Tenacious Challenge
Before you read this post please read Mike Olson's statement on the search status.
The Tenacious Challenge:
The Tenacious Challenge:
Maria Nieto Santisteban and Jeff Valenti (the JHU team) have provided a lot of good data. It is good to provide the full problem so that other teams/people can freely take a stab at it without having to read different sources in order to figure out where all the information is. The cross correlation work is really an inference problem based on data fusion (from different sensors and places.) I am sure some of you know somebody who does this well within your campus or organization.
1. Problem Statement
- There is this boat that is following currents (no sail, no engine). You have a model for these currents. The model is shown in some animated GIF here. The model for the current is provided in this dataset. It is a set of elements that are transported from day 0 till day 14. (Time starts at Jan 29, 00h00 GMT)
- The boat has been moving over several days because of the currents.
- There is no known spectral signature for the boat. This means that for every detector used for which the spatial resolution is coarse, we have a signal representing the presence of the boat but we do not know if this is the boat we are looking for or some other object. In particular, radar data indicate the presence of something but we do not know if this something is the boat of interest. The radar resolution is coarse and so is the ER-2.
- Several satellites, planes have flown over the differents areas at different times (see reference section below for bounding boxes). For each of these flights, data was acquired and several hits were obtained. Data from RadarSat1 were taken at day 2.6, RadarSat2 data were taken at day 5.1 and ER-2 data were taken at day 4.8
- In particular, because of the cloud condition, we believe that the radar data are the most accurate ones. Objects detected over the first radar pass (RadarSat 1) can be found here. Objects detected over the second radar pass (RadarSat 2) can be found here. Another set of objects were also detected by the ER-2 but we don't know to what extent it is affected by cloud (in other words, we might be missing some items from this detection scheme). Objects detected by the ER-2 are here.
- Our main objective is evaluating the transport/drift model and identify a potential target of interest.
The Tenacious Challenge, two questions:
- What are the hits on the RadarSat 1 pass that were detected on the RadarSat 2 pass ? We are assuming the following:
- not all hits of the first pass are in the second pass and inversely not all hits on the second pass are in the first pass.
- some hits on both the first and second pass are not following currents (powered boats going from place A to B)
- There is some inherent error in the transport solution. Any solution needs to state how bad this transport solution is.
- Does any pair identified in the RadarSat 1 and RadarSat 2 match an item detected by the ER-2 ?
We realize that the brain is a very nice inference engine, your solution may be just the description of all these data in a telling graphical manner.
2. Reporting your solution:
If you have a solution for this, please put a comment in this entry pointing to your solution (blog, website...) where you state your results and how you arrived to these results. We are assuming the rank of the target indentified is also its name, for instance the third target identified in the radarsat1 case should be called radarsat1-3. Any pair should then be labeled: Radarsat1-3/RadarSat2-17 for instance.
3. References:
[1] Bounding box coordinates for ER-2 flights are here.
[2] Bounding box coordinates for both the Radarsat1 and Radarsat2 flight are here. Bounding box coordinates for RadarSat 1 flight (Jan31) are here.
[3] Bounding box coordinates for the RadarSat 2 flight (Feb3) are here.
[4] JHU team website with actual images of targets is here.
[5] http://nuit-blanche.blogspot.com/2007/02/finding-jim-gray-approximate-data.html
Finding Jim Gray: Astronaut acquired photographs
I mentionned Astronaut acquired photographs as a way to help in finding the Tenacious. Here what the view of the International Space Station would look like. One can figure out if the ISS is flying over that region here.

Finding Jim Gray: Another example of multispectral imagery of interest
In a previous entry, I mentionned the fact that multispectral sensors from Landsat 7 could be used to spot boats of the size of Tenacious because of the high contrast between the boat and the ocean waters. Sorin Popescu showed me some imagery from Landsat 7 confirming the finding from Lawrence Ong. Here is a telling image of the Galveston bay.

Unfortunately, I just re-did a search on the Landsat database (EarthExplorer of the USGS) and the cloud situation is as bad as what Envisat shows except for Feb 12.


Unfortunately, I just re-did a search on the Landsat database (EarthExplorer of the USGS) and the cloud situation is as bad as what Envisat shows except for Feb 12.


Thursday, February 15, 2007
Finding Jim Gray: Why Radar should be used first.
Feb 1 Feb 2
Feb 2
 Feb 4
Feb 4
 Feb 2
Feb 2 Feb 4
Feb 4
There is nothing better than actual sighting given the right resolution as provided by Quickbird or Ikonos. If we have some confirmation that somehow the cross section of Tenacious to radar is none zero, then it was detected by radarsat if the boat was about that region. Here is the extent of the problem for the visible range)Quickbird, Ikonos, ER-2). Images are from Envisat of the region starting Feb 1. I am not saying we could not see anything, I am saying there is a high probability we did not have a shot of Tenacious even when flying over it.
Finding Jim Gray: Approximate Data Fusion/ An inference problem
We are dealing with an inference problem of the worst kind. Trying to find a target of unknown spectral signature in a different areas over time knowing that it moved over time. The drift models are essential in figuring out how the same target can be transported from location to another. We are also facing the fact that there are many elements, also of unknown signature that do not follow the drift models (because they are doing everything possible to go from point A to point B) or are spectrally equivalent to our target of interest. In other words we have to find a target of interest for which, given a drift model, is consistently identified when weather permits as being in the near vicinity of a target as detected by the different sensors and means of acquisition. In particular, the question of why the coast Guards did not see anything on Feb 1 must be answered.
 Day 2.6
 Day 4.8
 Day 5.1
Maria Nieto-Santisteban and Jeff Valenti at John Hopkins University (The JHU group) have used the ocean current models provided by the OurOcean folks at JPL to create an animated GIF of how markers move with the currents. Relevant satellite and aerial imagery were obtained 2.6, 4.8, 5.1, and 5.8 days after the adopted zero point in time (Jan 29, 00:00 GMT).
The Radarsat images do not suffer from the clouds or fog. They were also taken very early on the search (Jan 31 and Feb 3). Quickbird and Ikonos shots would be useful in evaluating if any of the radar targets are of interest. My assumption is that Tenacious responded to the radar but was probably covered by clouds when visible light satellite or planes (ER-2) passed over it.
Following this thinking, I produced a kml file for the Radarsat images as processed by Maria and Jeff (it needs to be polished, anybody ?) and probably needs to have the ER-2 data. The Mechanical Turk data findings are not available online. One can see part of the kml file directly on Google Maps but it does not display well because it is too big for Google Maps in this fashion.
The major capability provided by the JPL folks is in the ability to remove targets that are really false positives. And so instead of looking at ocean current models and try to fit the targets found by Radarsat, it would be interesting to figure out how targets on Jan 31 found by Radarsat were transported to another position on Feb 3 using the model. By evaluating the distance between targets of Jan 31 transported by the JPL model and actual targets found on Feb 3, we would have a good view of the ones for which the model is accurate. Then, we could evaluate if any of the targets found by Quickbird on Feb 2 and Feb 3 are anywhere close (why use the radarsat images first) It is also of paramount importance that one uses the JPL current models with a grain of salt. This is fluid mechanics after all.
By eyeballing the Radarsat targets and the crosses of the JPL model, one seem to see some similar features pointing to the potential correctness of the ocean current model. Some of targets could be removed using the Quickbird imagery.


Monday, February 12, 2007
Finding Jim Gray: Quantifying the state of our knowledge / Quantifying the state of our ignorance

The more I am looking at some of the multispectral images, the more I am convinced that the obstruction of the clouds should not be discounted. But more importantly, another issue is the data fusion from different sensors.
Thanks to both the John Hopkins and the University of Texas websites, we have data from a radar (radarsat) or in the visible wavelength regime (ER-2, Ikonos, Coast guard sightings). Every sensor has a different spatial and spectral resolution yet some can see through clouds whereas others cannot. Multispectral could be added to this mix but they suffer from low spatial resolution (lower than the radar) while having higher spectral resolution. Other information such as human sightings by private airplane parties should also be merged with the previous information. [ As a side note I have a hard time in convincing the remote sensing people that spatial resolution is not an issue as long as we can detect something different from the rest of the background.]
Finally, the other variable is time. Some areas have been covered with different sensors at different times. This is where the importance of the drift model become apparent.

The state of our knowledge of what is known and what is not known becomes important because as time passes by, it becomes difficult to bring about the resources of search and rescue teams. I have been thinking about trying to model this using a Maximum Entropy (Maxent) but any other modeling would be welcomed I believe. The point is that when a measurement is taken at one spatial point, we should look at it as if it were a measurement that will vary with time. The longer you wait, the more you won't know if the Tenacious is there or not.
For those points were we have identified potential targets, we need to give them some probability that Tenacious is there but we also know that if we wait long enough, there will be a non-null probability to have gone away from that point. Also, this formalism needs to allow us to portrait the fact that no measurements were taken over certain points in a region where other points were taken (the issue of clouds). This is why I was thinking of implementing a small model based on the concept of Probabilistic Hypersurface a tool designed to store and exploit the limited information obtained from a small number of experiments (a simplified construction of it can be found here). In our case, the phase space is pretty large, each pixel is a dimension (a pixel is the smallest pixel allowed for the spatial resolution of the best instrument). All pixels together represent the spatial map investigated (this is a large set). The last dimension is time. In this approach the results of JHU and UCSB as well as the Mechanical Turk could be merged pretty simply. This would enable us to figure out if any of the hits on Ikonos can be correlated to the hits on Radarsat. But more importantly, all the negative visual sightings by the average boater could be integrated as well in there because a negative sighting is as important as a positive one in this search. And if computational burden become an issue for the modeling, I am told that San Diego State is willing to help out big time.
[added note:
What I am proposing could already be implemented somewhere by somebody who is working in areas of bayesian statistics, maximum entropy techniques. Anybody ?]
Saturday, February 10, 2007
Finding Jim Gray: Landsat 5 and 7, Envisat actual coverage with timeline results
[my thoughts on how to represent our current knowledge and maybe prioritize search and resuce efforts can be found here]
Here is the screen grab of a search made on the EarthExplorer website of the USGS.
Landsat 5

Landsat 7
 Landsat 5, Jan 28
 Landsat 7, Jan 29
 Landsat 5, Jan 30
 Landsat 7, Feb 1
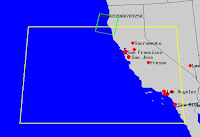 Landsat 5, Feb 2
 Landsat 7, Feb 3
 Landsat 5, Feb 4

The Envisat images were taken more often over the bay area.

The screen grab of the search results show a preview of the images on the left. Many of these views are obstructed by a large cloud cover.

Here is the screen grab of a search made on the EarthExplorer website of the USGS.
Landsat 5

Landsat 7
 Landsat 5, Jan 28
 Landsat 7, Jan 29
 Landsat 5, Jan 30
 Landsat 7, Feb 1
 Landsat 5, Feb 2
 Landsat 7, Feb 3
 Landsat 5, Feb 4
The Envisat images were taken more often over the bay area.

The screen grab of the search results show a preview of the images on the left. Many of these views are obstructed by a large cloud cover.

Friday, February 09, 2007
Finding Jim Gray: Result of search on Earth Explorer
Using EarthExplorer from the USGS, one can find several multispectral datasets on the region of interest for Jim Gray's search.

This is what the bay area looked like on Feb 3, 2007 as seen by Landsat 7 at 10:36 AM (local time) [ This is the low resolution of the actual image]


This is what the bay area looked like on Feb 3, 2007 as seen by Landsat 7 at 10:36 AM (local time) [ This is the low resolution of the actual image]
Entity ID 7044034000703450 taken on 2007/02/03

Entity ID 7044035000703450 taken on 2007/02/03

Subscribe to:
Posts (Atom)